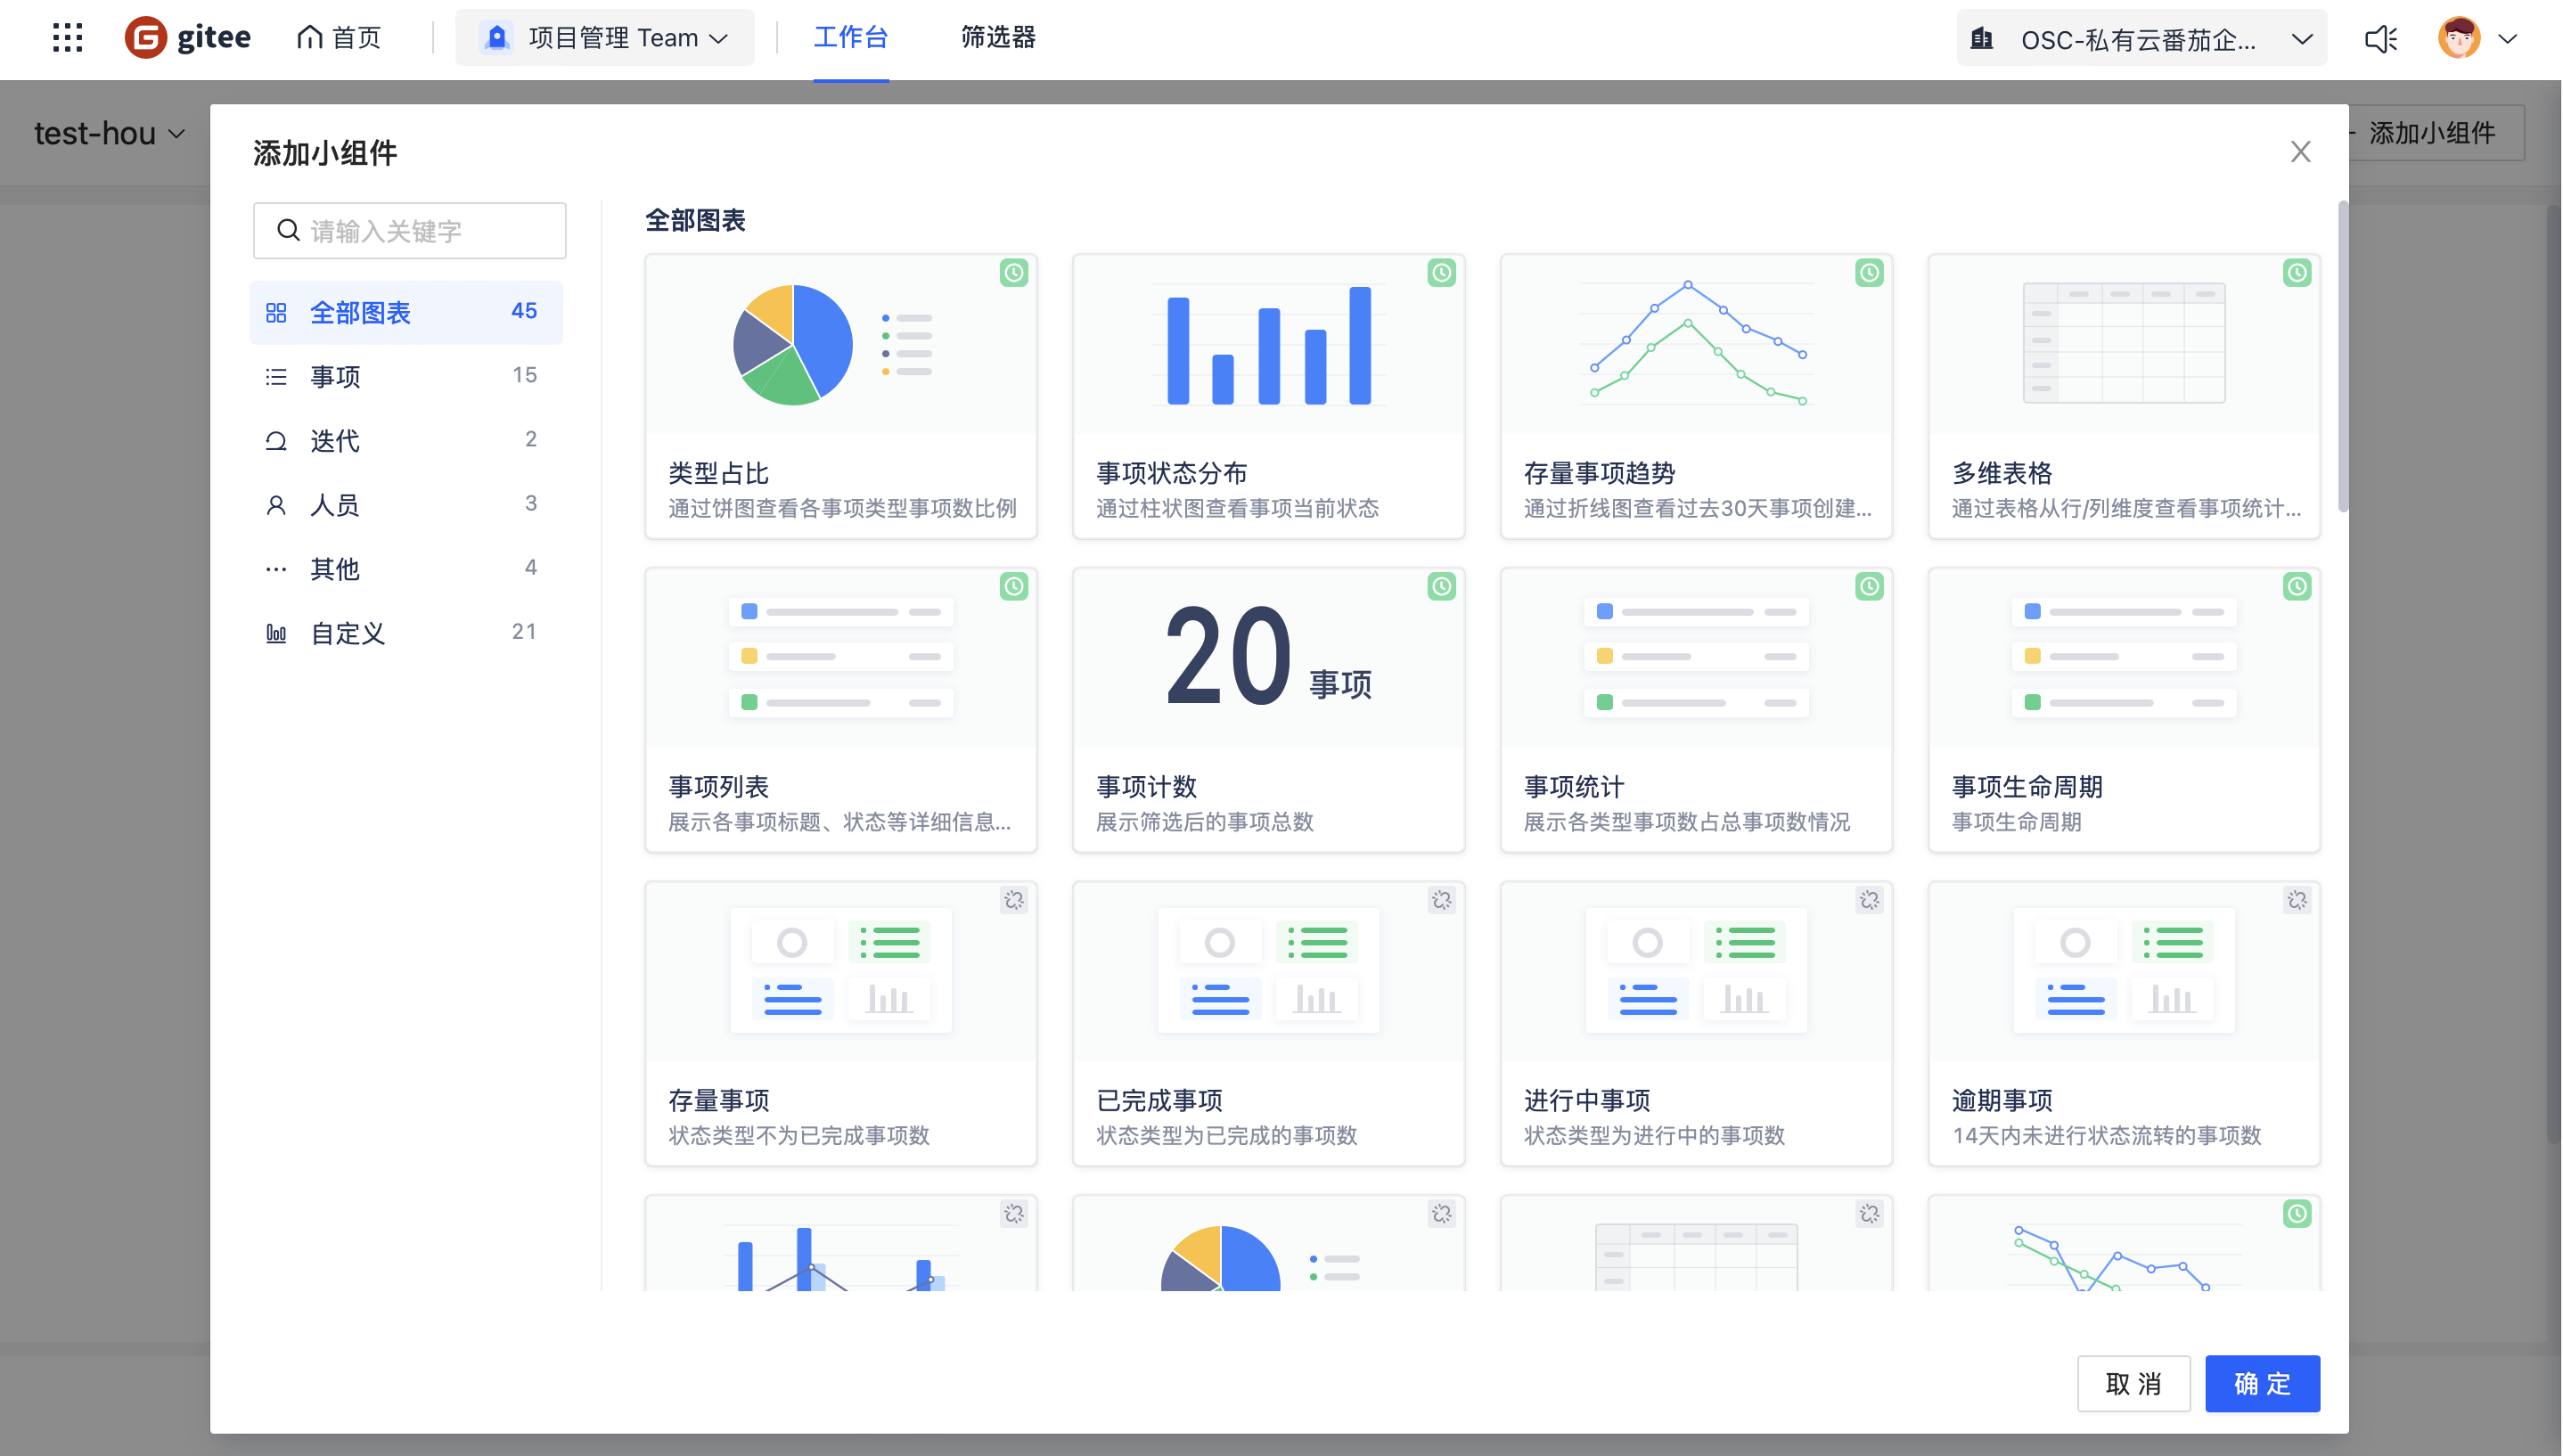
Item-Related Charts
Click Add Widget, select All Charts category. The report component data in this category is real-time data (dimension and value default configurations do not need editing when configuring components).
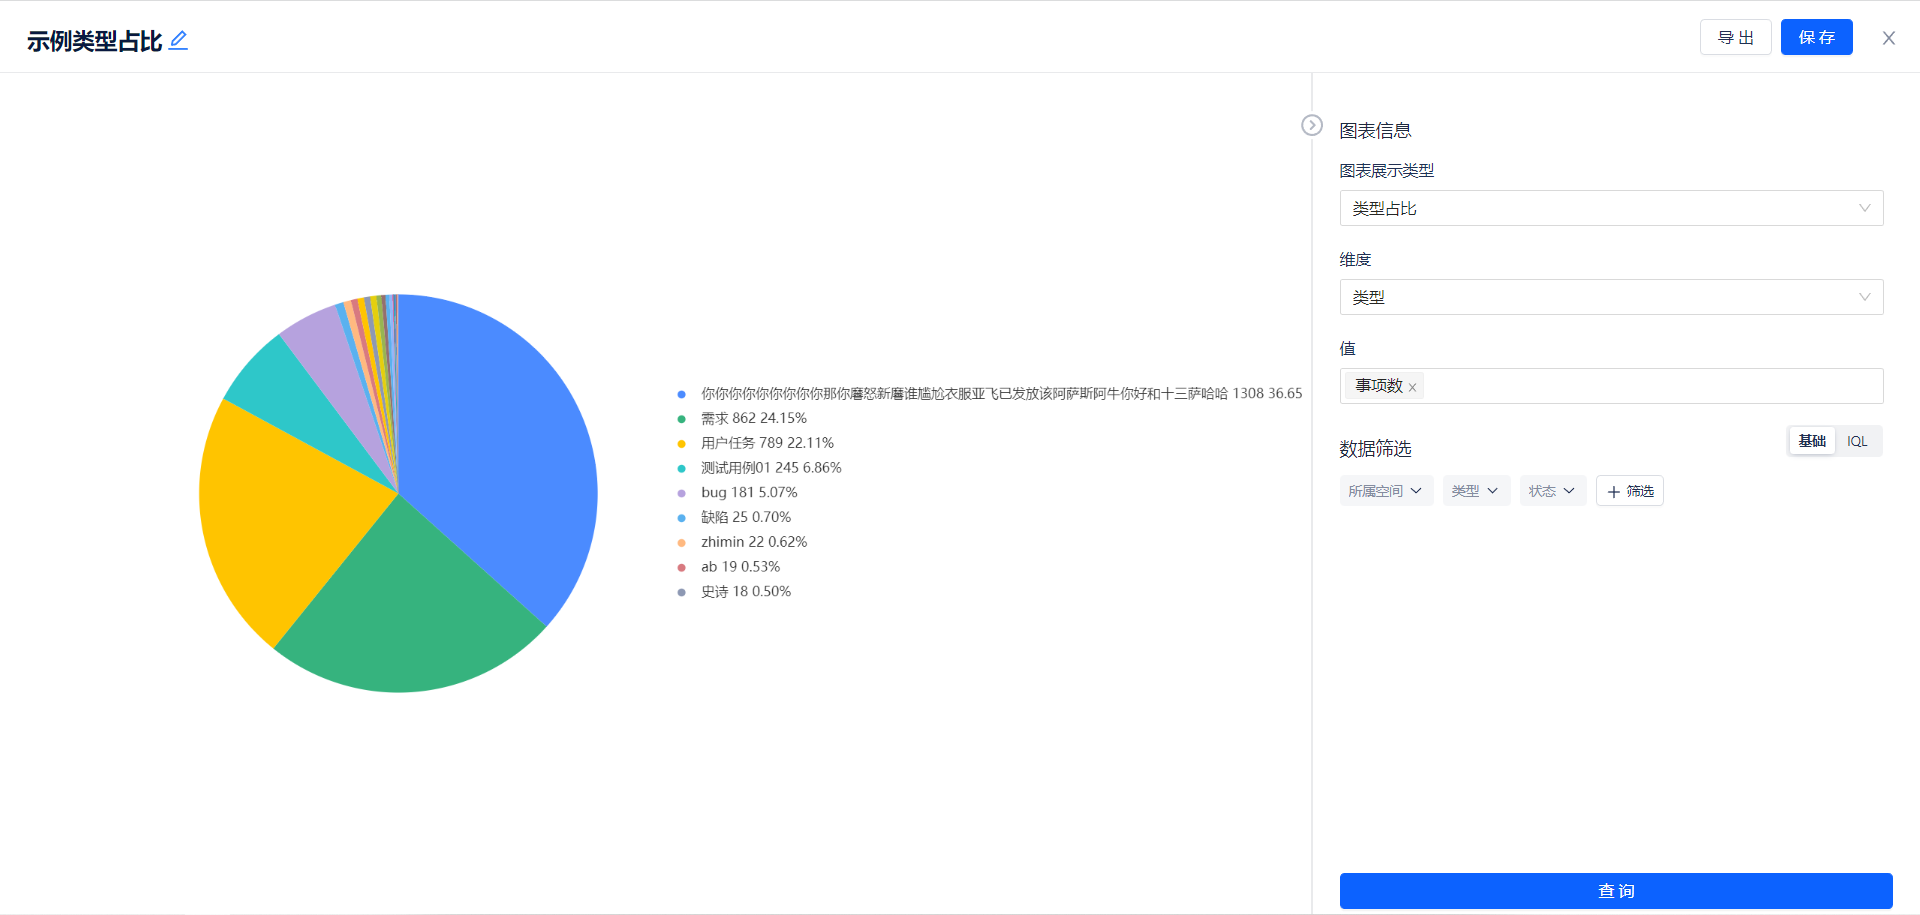
Type Proportion
-
Use case: View the proportion of items by type through pie charts
-
Steps:
- Select Type Proportion, click OK
- Filter data as needed
- Click Query
- Click Save in the top right corner and name the component
- You can also click Export in the top right corner to export this report data, which will download an Excel file locally
Example:
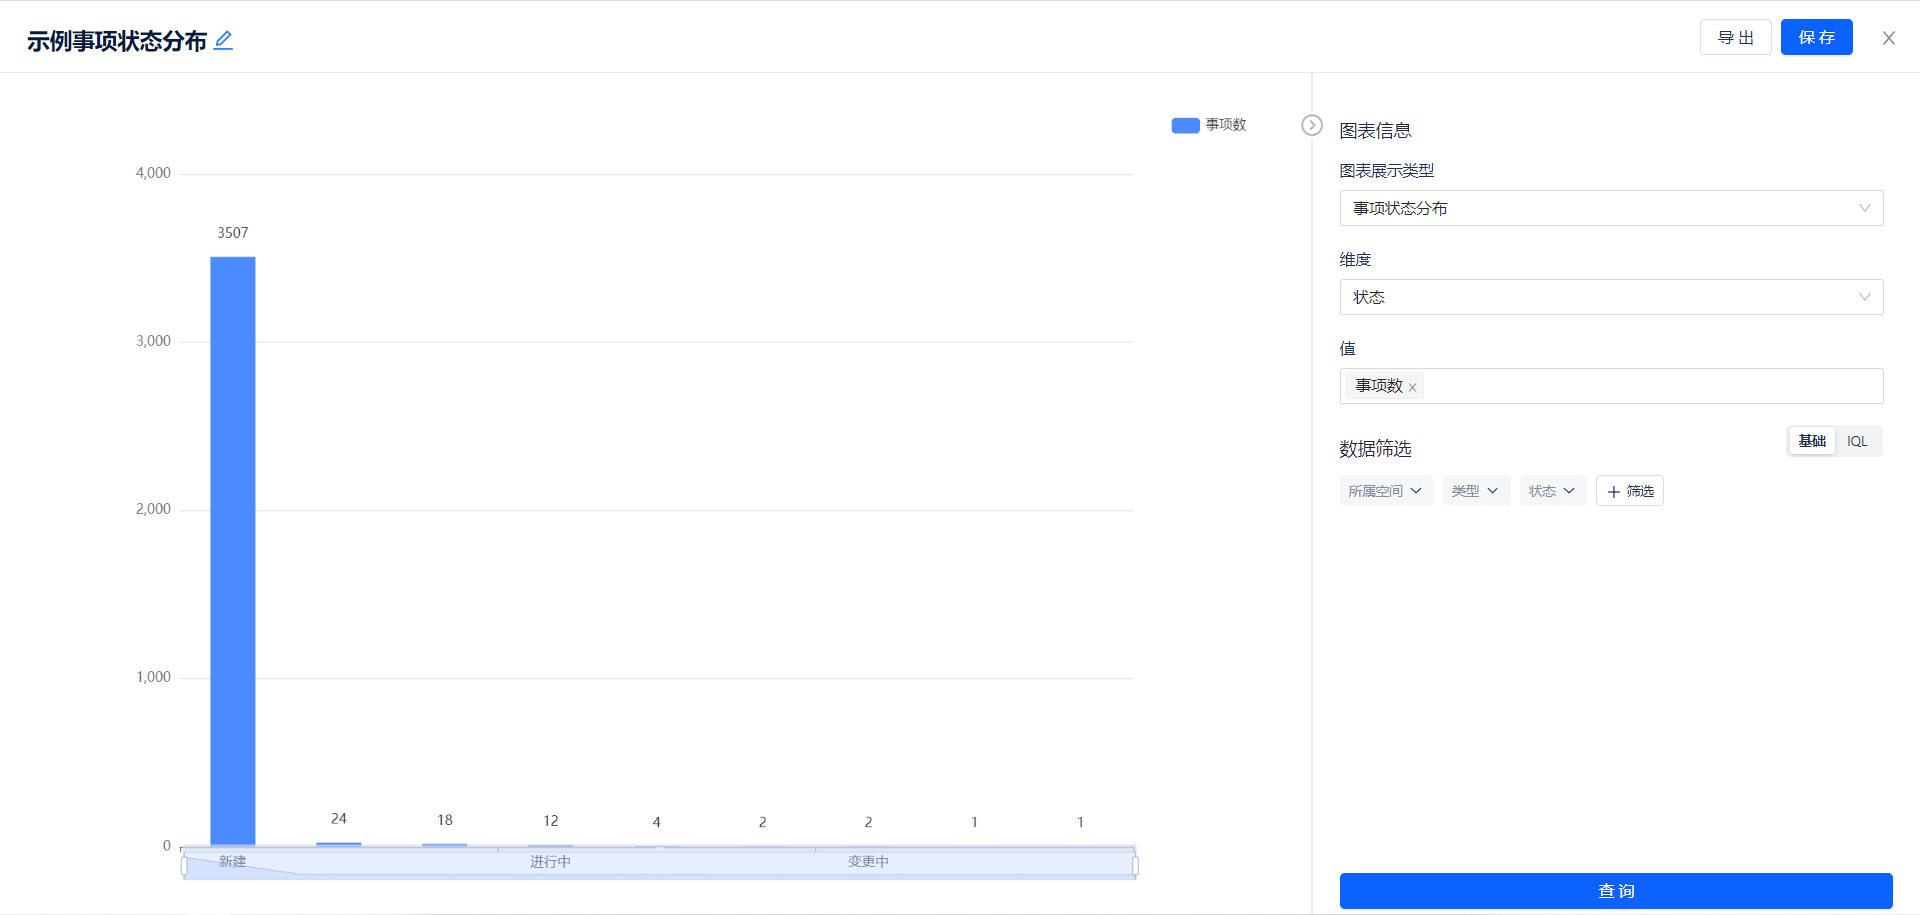
Item Status Distribution
-
Use case: View which statuses items are in through bar charts
-
Steps:
- Select Item Distribution, click OK
- Filter data as needed
- Click Query
- Click Save in the top right corner and name the component
- You can also click Export in the top right corner to export this report data, which will download an Excel file locally
Example:
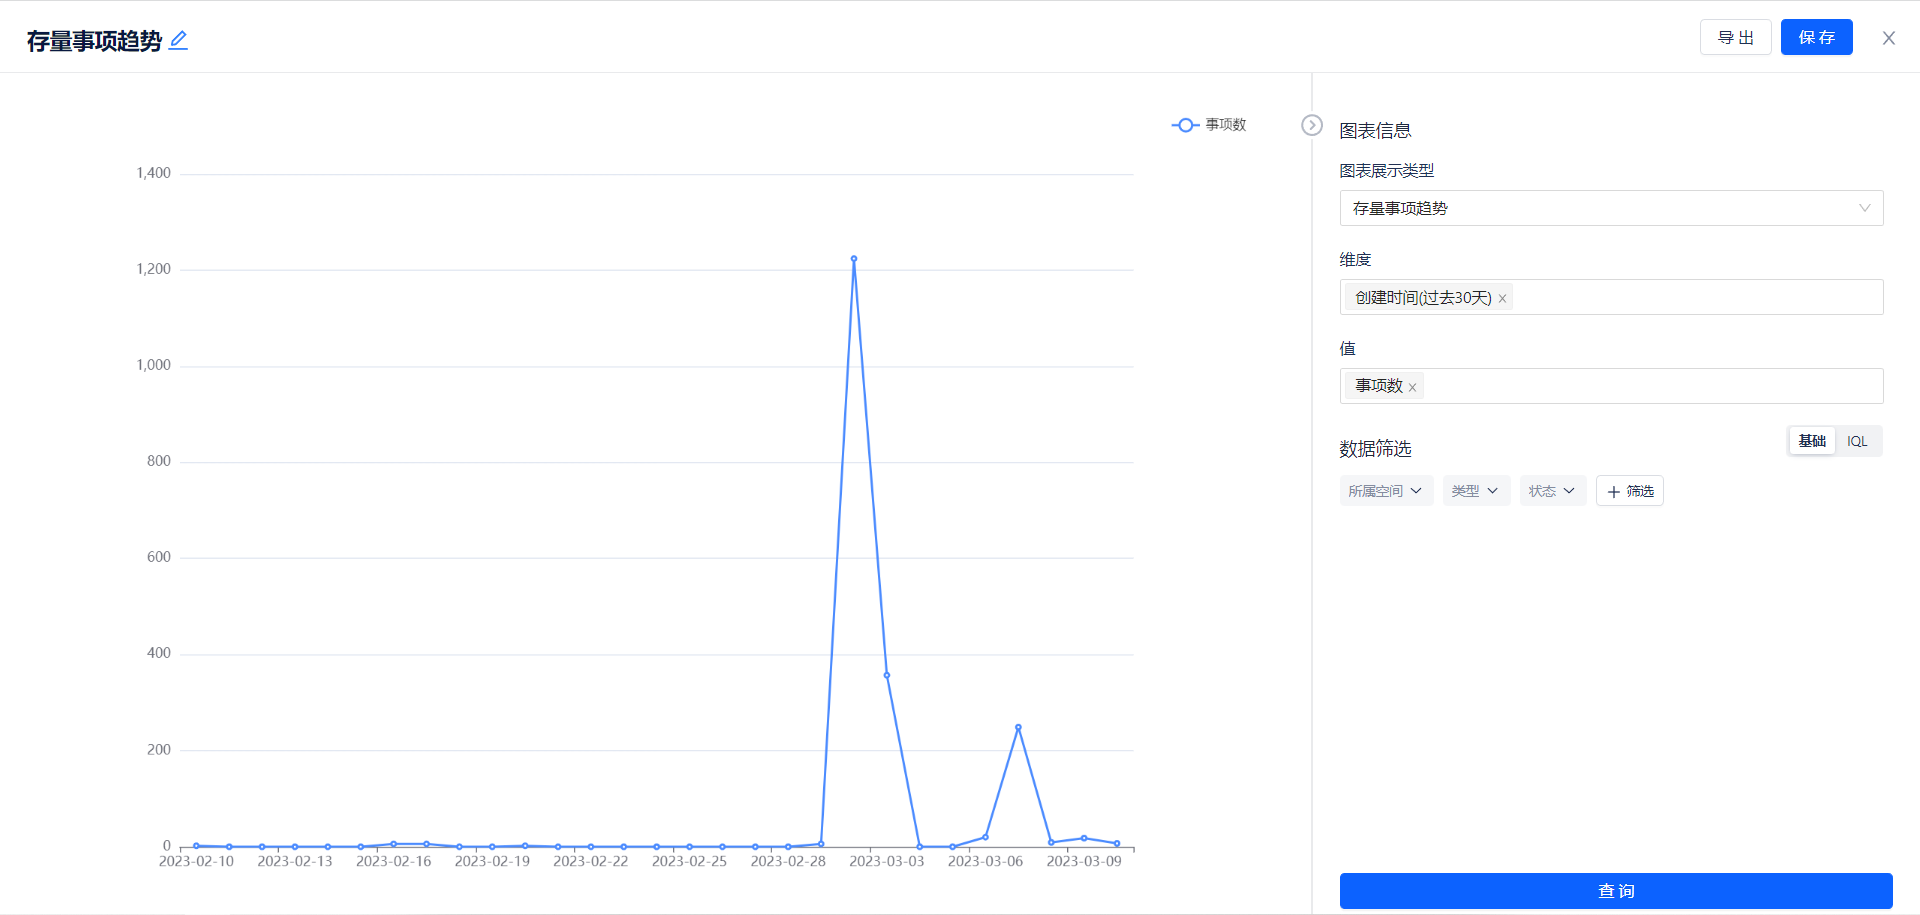
Existing Item Trends
-
Use case: View item creation trends over the past 30 days through line charts
-
Steps:
- Select Existing Item Trends, click OK
- Filter data as needed
- Click Query
- Click Save in the top right corner and name the component
- You can also click Export in the top right corner to export this report data, which will download an Excel file locally
Example:
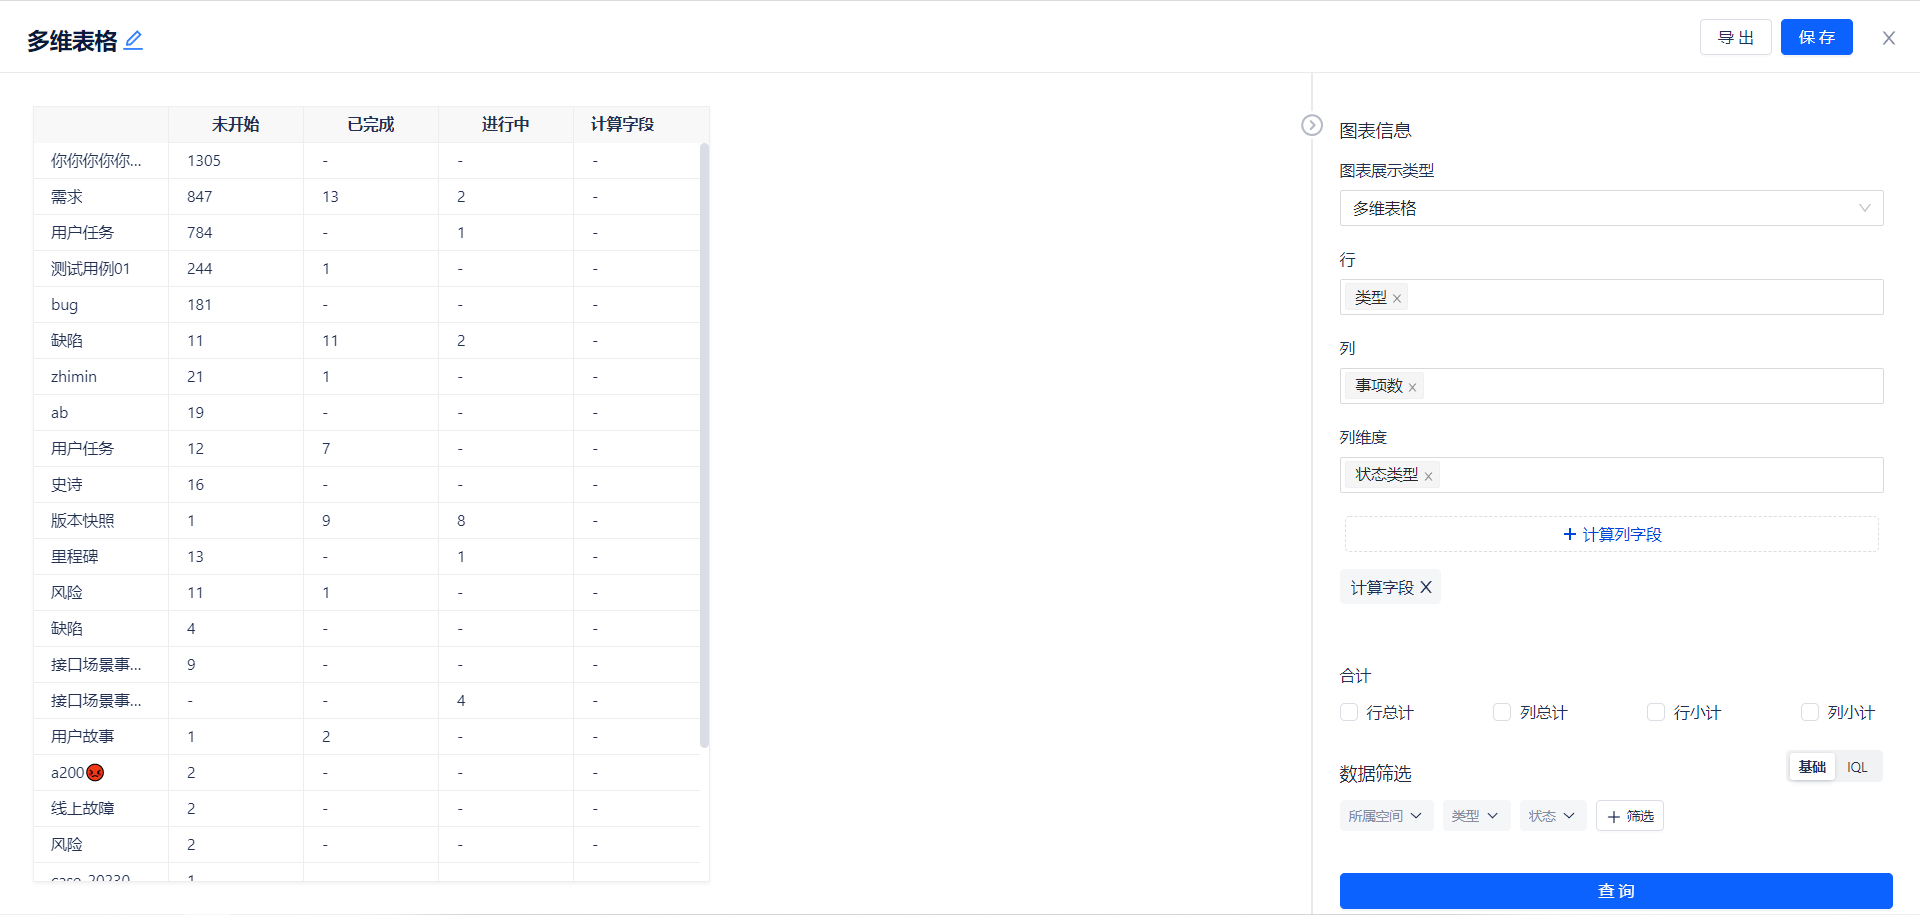
Multi-dimensional Table
-
Use case: View item statistics from row/column dimensions through tables
-
Steps:
- Select Multi-dimensional Table, click OK
- Select row/column totals/subtotals as needed
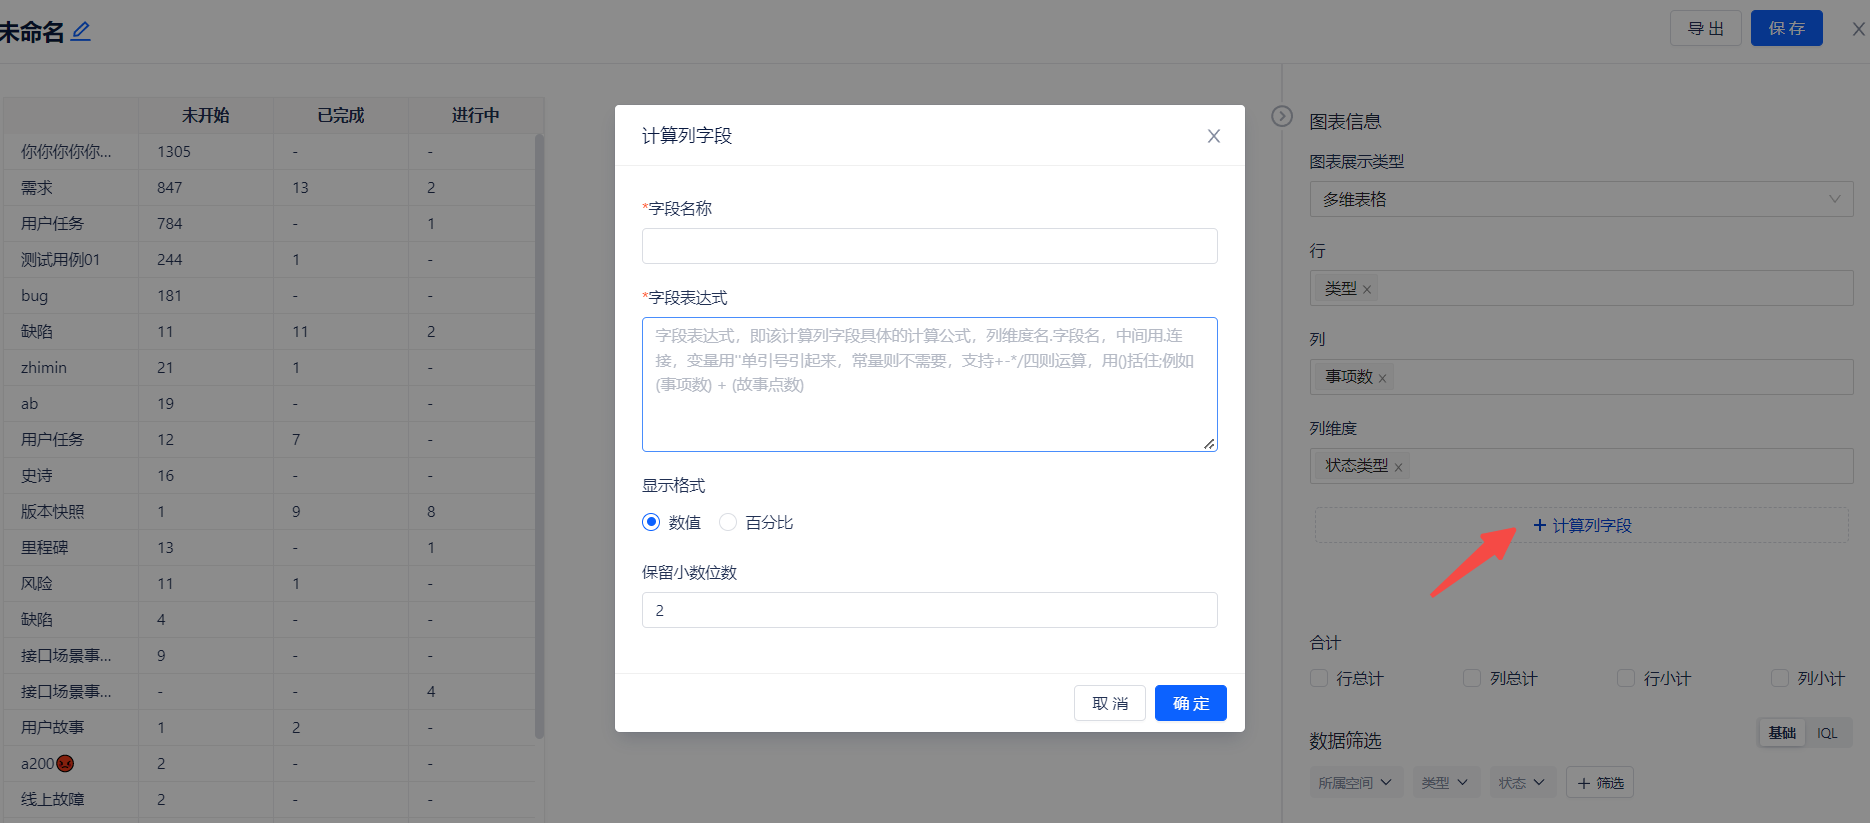
- Configure calculated column fields as needed (see details below)
- Filter data as needed
- Click Query
- Click Save in the top right corner and name the component
- You can also click Export in the top right corner to export this report data, which will download an Excel file locally
-
Calculated Column Field Function
- Perform arithmetic operations on fields to generate new calculated fields for display
- Perform arithmetic operations on fields to generate new calculated fields for display
Example:
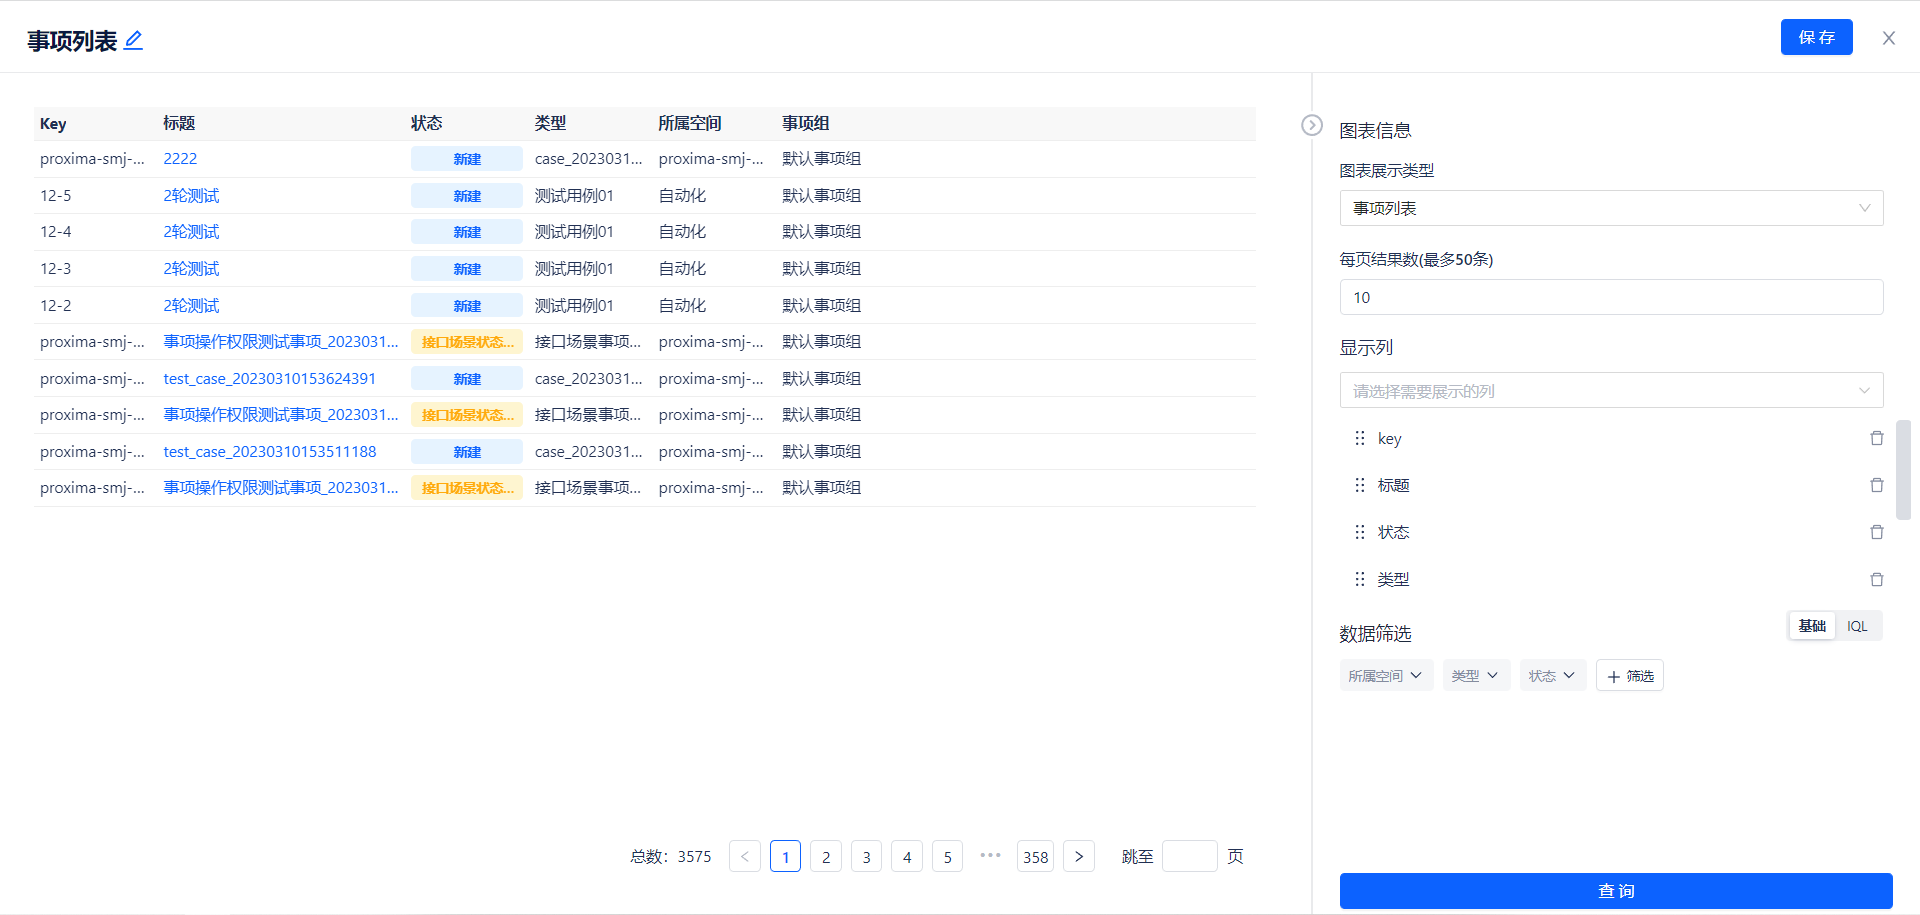
Item List
-
Use case: Display detailed information list of item titles, statuses, etc.
-
Steps:
- Select Item List, click OK
- Configure items per page, display headers, and data filtering as needed
- Click Query
- Click Save in the top right corner and name the component
Example:
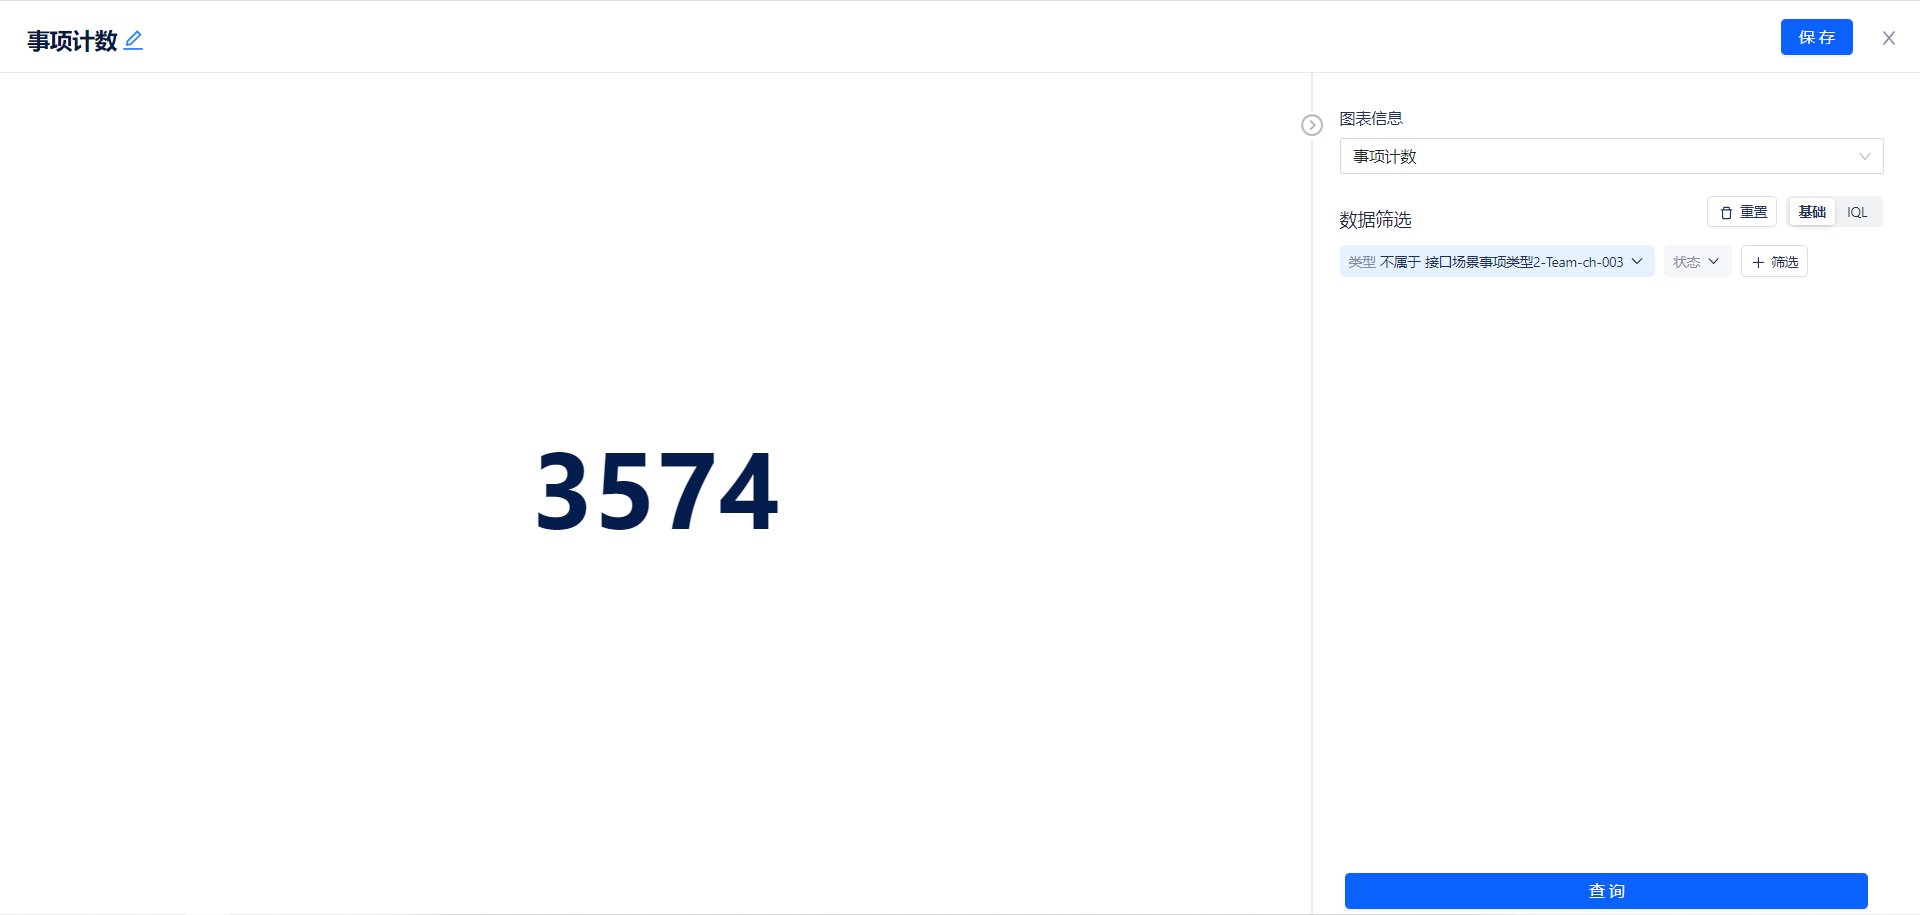
Item Count
-
Use case: Display the total number of items after filtering
-
Steps:
- Select Item Count, click OK
- Configure and filter data as needed
- Click Query
- Click Save in the top right corner and name the component
Example:
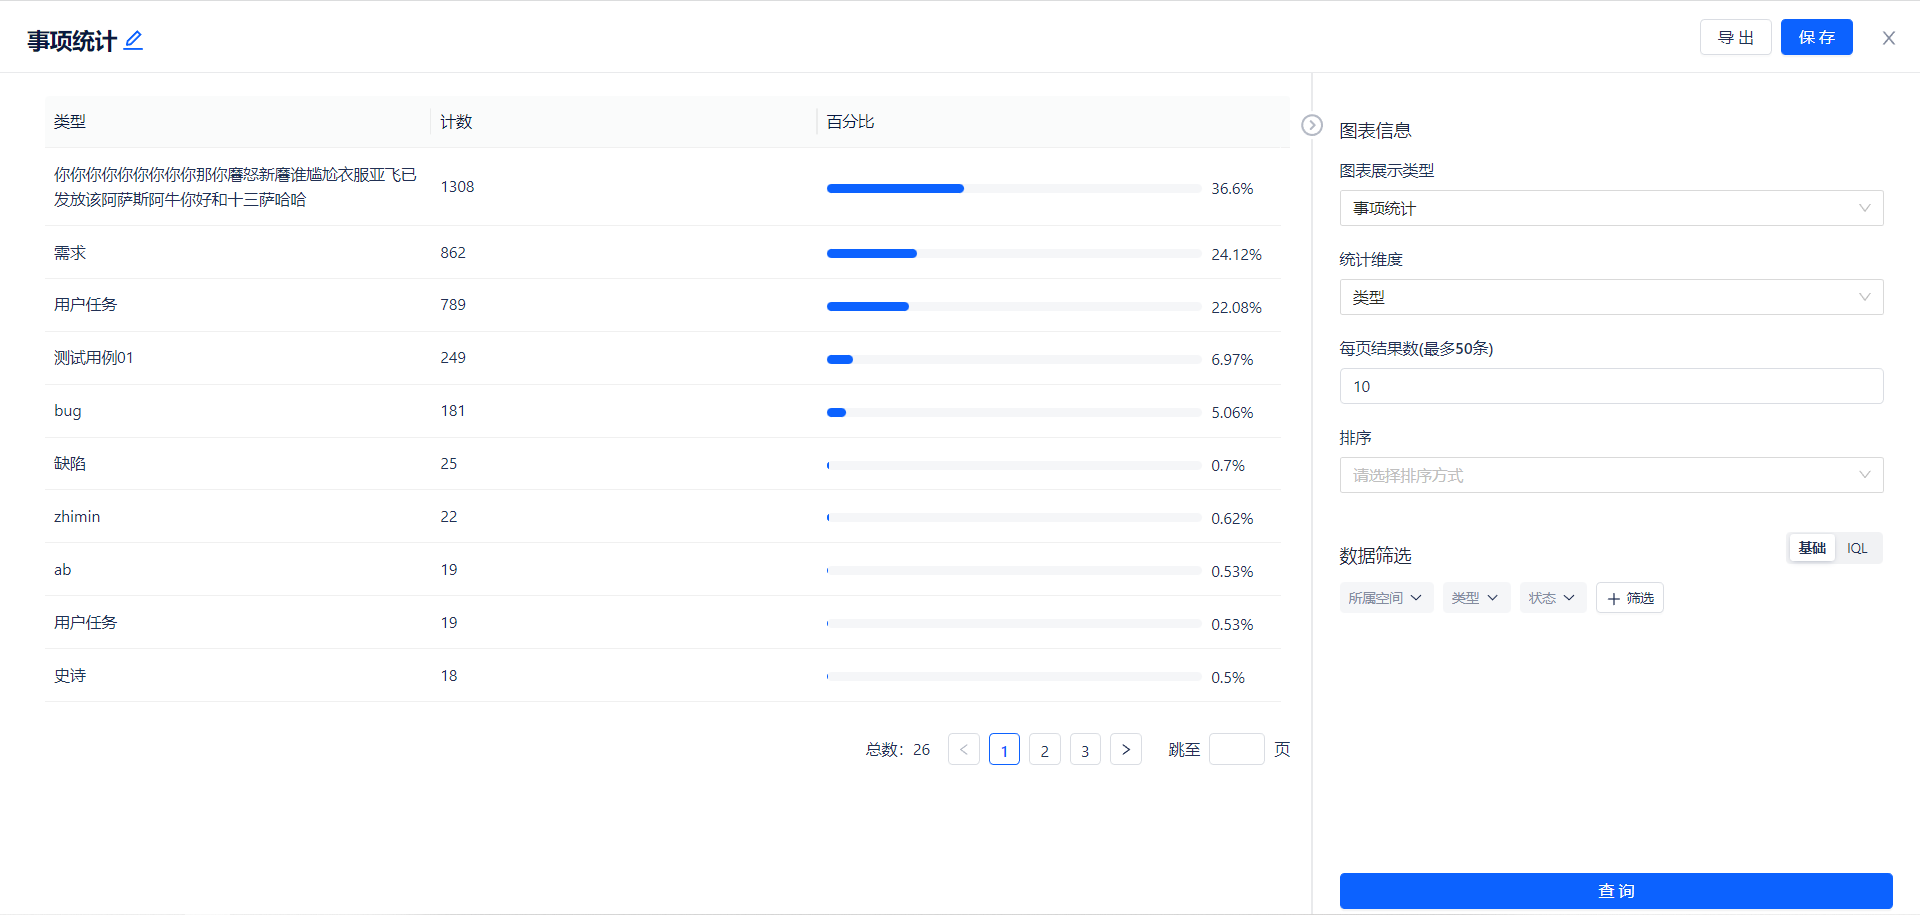
Item Statistics
-
Use case: Display the proportion of each type of item to total items
-
Steps:
- Select Item Statistics, click OK
- Configure statistical dimensions, results per page, sorting method, and data filtering as needed
- Click Query
- Click Save in the top right corner and name the component
Example:
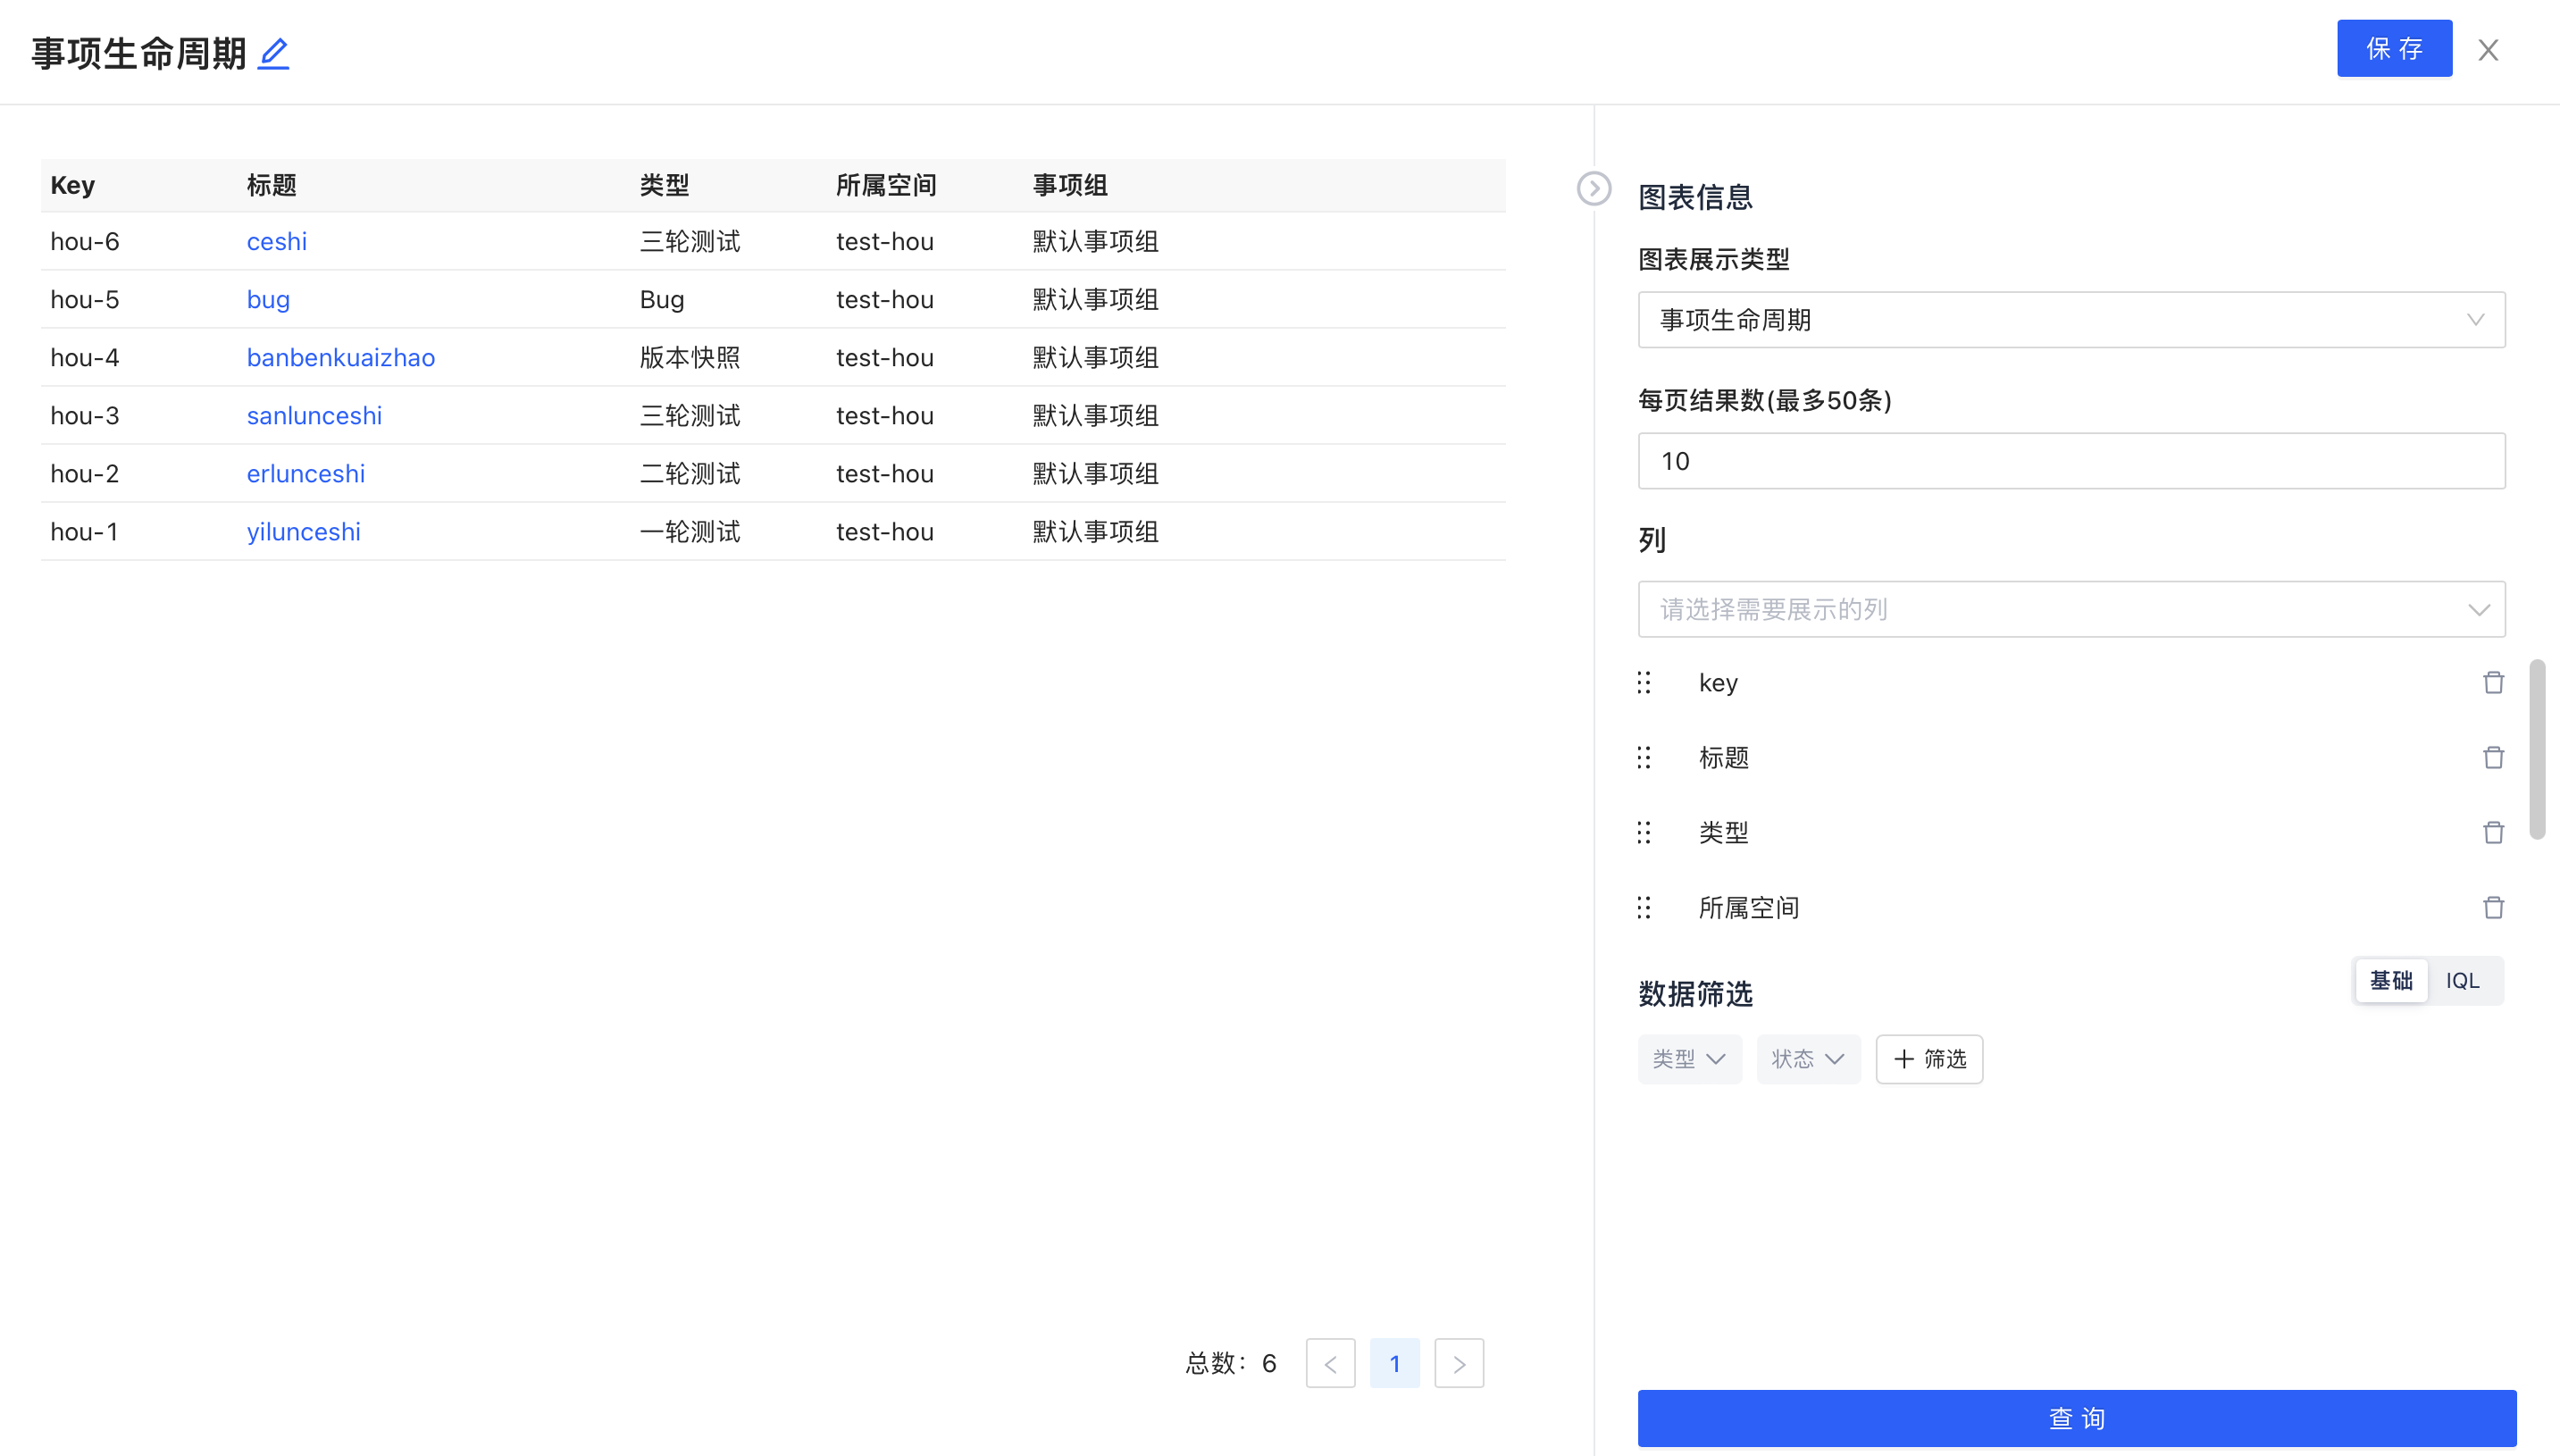
Item Lifecycle
-
Use case: Display item lifecycle
-
Steps:
- Select Item Lifecycle, click OK
- Configure results per page, columns to display, and data filtering as needed
- Click Query
- Click Save in the top right corner and name the component
Example: